
Softway: Culture+ Counter
Designing a strategic NPS dashboard from scratch that let leaders tangibly attribute work culture to business performance.
- 4
- named enterprise clients won
- 7
- user interviews
- 12
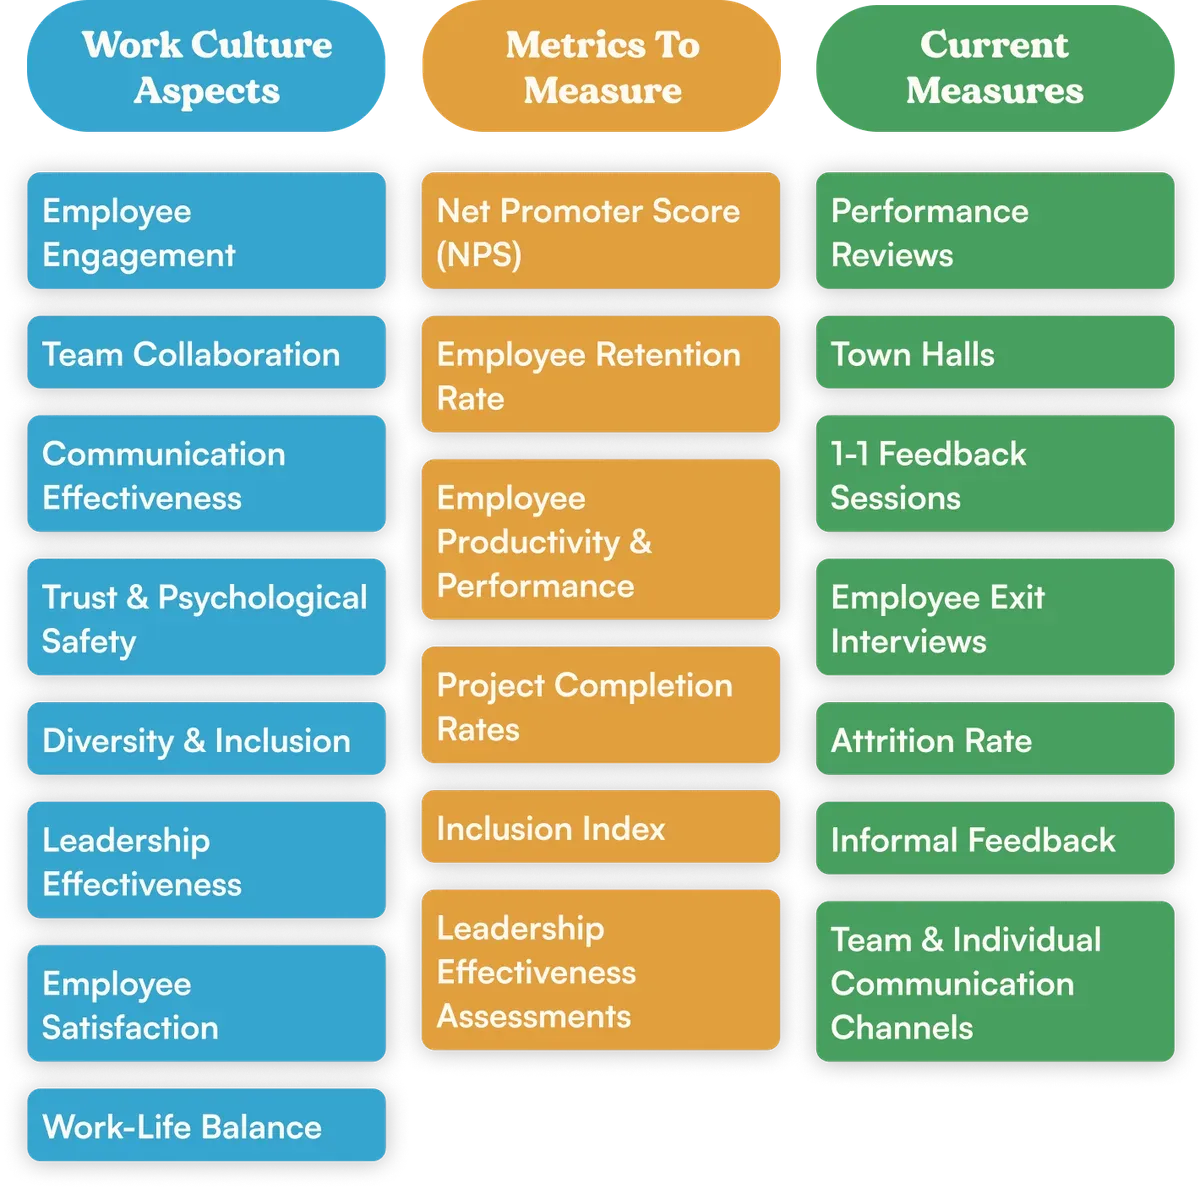
- work-culture aspects measured
Context
Softway is a digital transformation agency in Houston, Texas, whose mission is to bring humanity to the workplace. Its sub-brand, Culture Plus, helps companies achieve the high-performance, high-reliability cultures that win in the marketplace.
In 2020, COVID-19 lockdowns took a toll on companies’ culture: remote work disrupted traditional workplace dynamics, hindering social connections and spontaneous interactions. Softway launched four products that year in response: Seneca Leaders, Seneca Go, Culture+ Bridge and Culture+ Counter.
Culture+ Counter was the measurement layer: an NPS-based tool that tracked the cultural impact of the other three and tied it to business outcomes. For the first time, you could tangibly attribute culture to business performance. I designed it from scratch, in phases; this covers Phase 1.
The problem
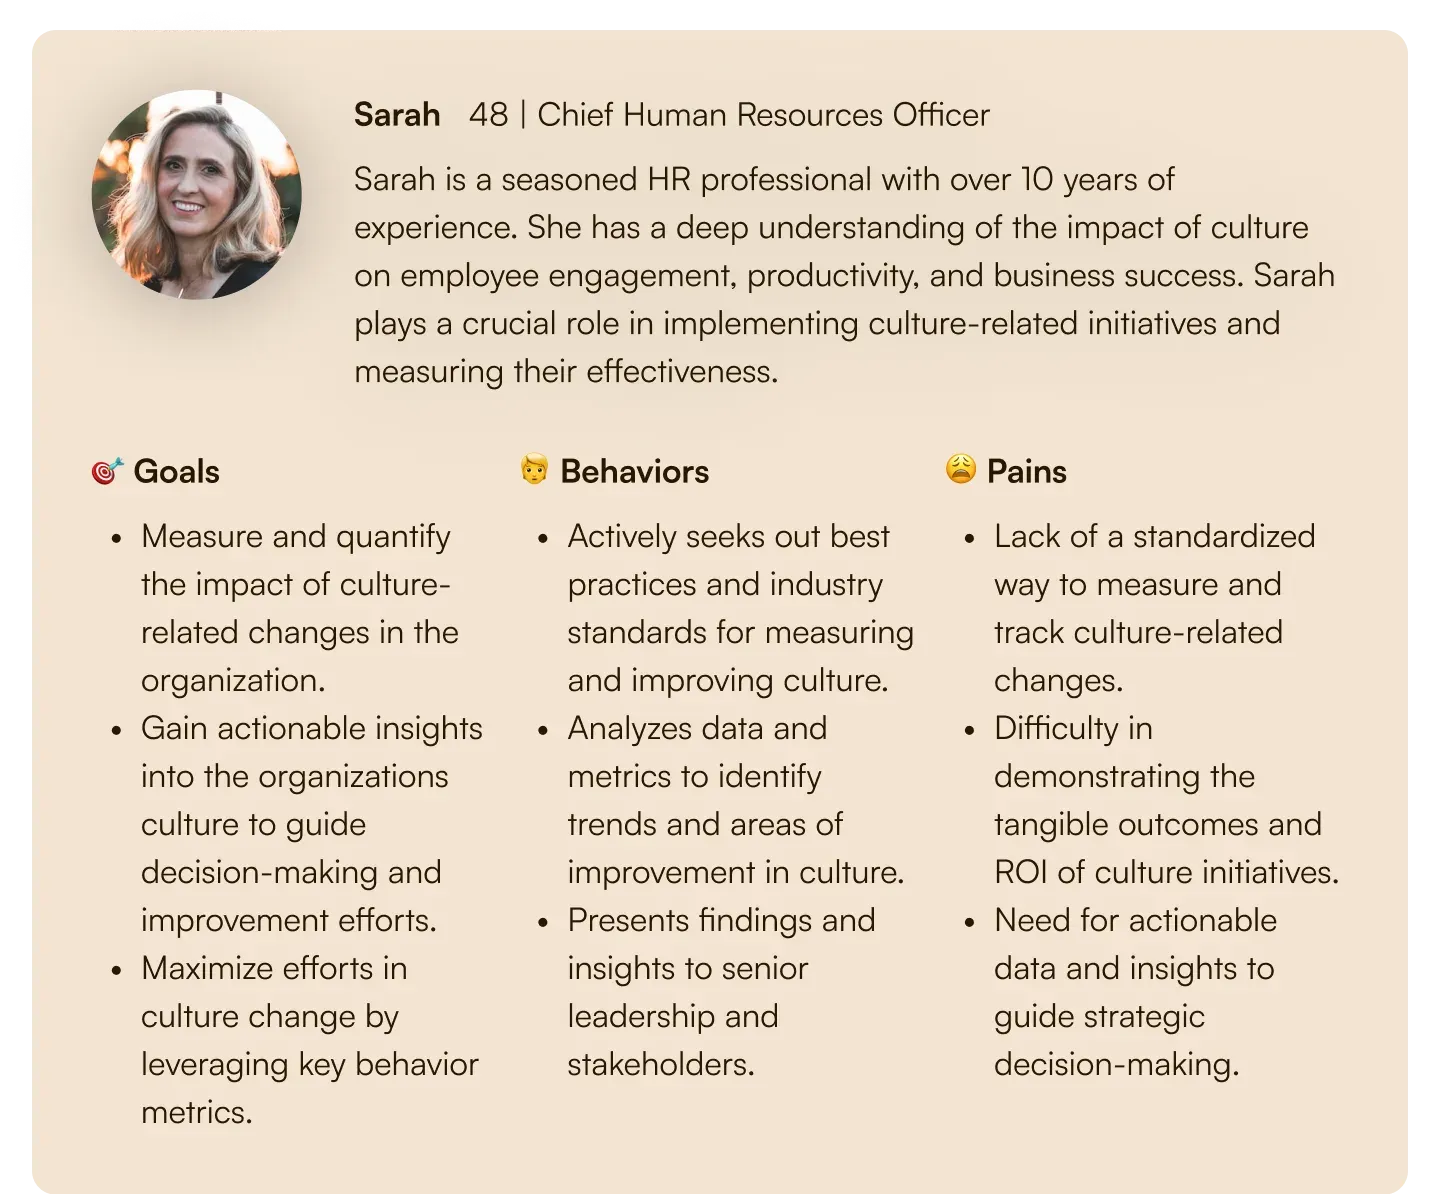
“Okay, Softway is helping us better our culture, but how do we know or measure the ROI of our efforts?” That question came up again and again from leaders at the orgs we spoke to. Culture work was happening, but none of it was measurable, so none of it reached a board conversation.
The existing ways of taking a pulse failed in the same direction. Performance reviews, 1-1 feedback sessions and exit interviews either reached the org too late or not at all. And 1-1s carried a trust problem: most employees weren’t comfortable telling their own manager what they thought about leadership or the state of the org.
The brief: how might we enable leaders to measure and demonstrate the ROI of culture change, while providing actionable insights to drive continuous improvement?
My role
I was the sole designer on Culture+ Counter, running the full arc: problem framing, research, define, ideate, prototype, test.
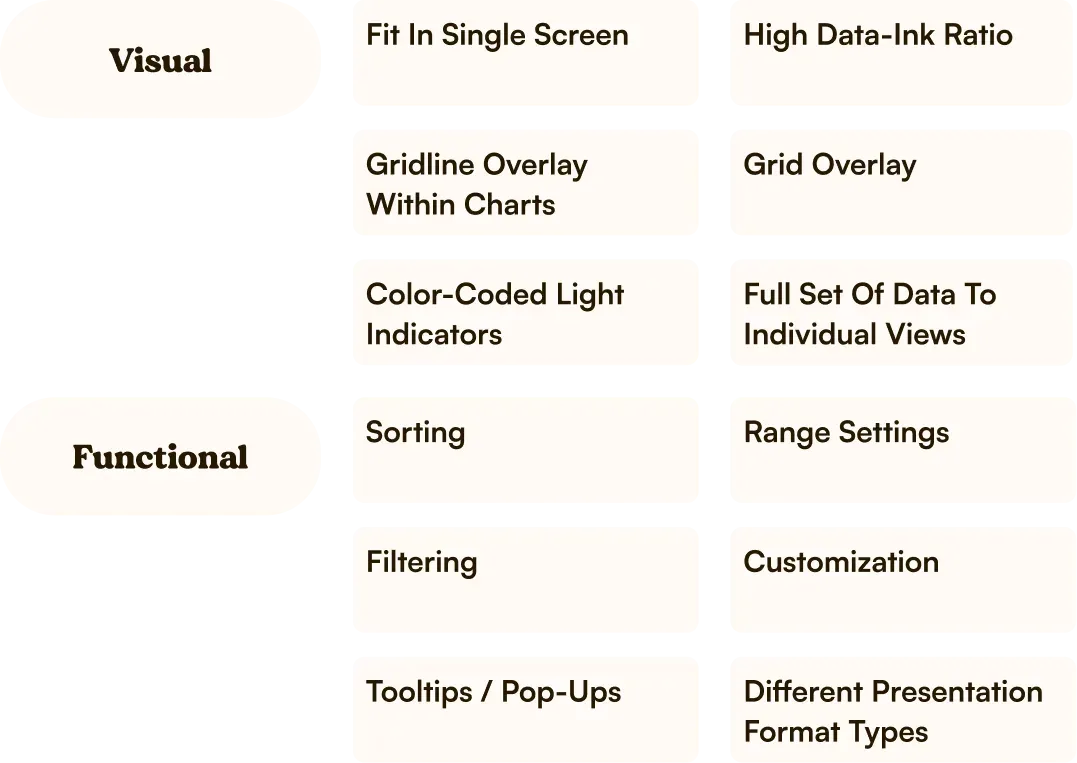
What I designed: the research plan and the seven interviews behind it; the desk research on dashboard taxonomy; the persona and journey map; the twelve work-culture aspects and the categories they roll into; the data-visual component library, built with Atomic Design so every chart was a reusable part rather than a one-off; two dashboard directions and the merged final one; and the Behavior details page with its filtering model.
What I took to a shipped product: I specified the inputs to the proprietary scoring formula and the rules every visual had to obey: what a score meant, when an alert state fired, how NPS decomposed into Promoters, Passives and Detractors, and what each filter did to the data set. Then I worked with the engineering team through the build of the first working prototype, which sales took out as a live part of Softway’s offering.
Approach
Lockdowns meant we couldn’t yet interview people in these roles at other companies, so I ran seven internal interviews with leaders and HR executives who already held them, asking which aspects of work culture to measure, which metrics best show ROI on cultural change, and how anyone gets a pulse on culture today.
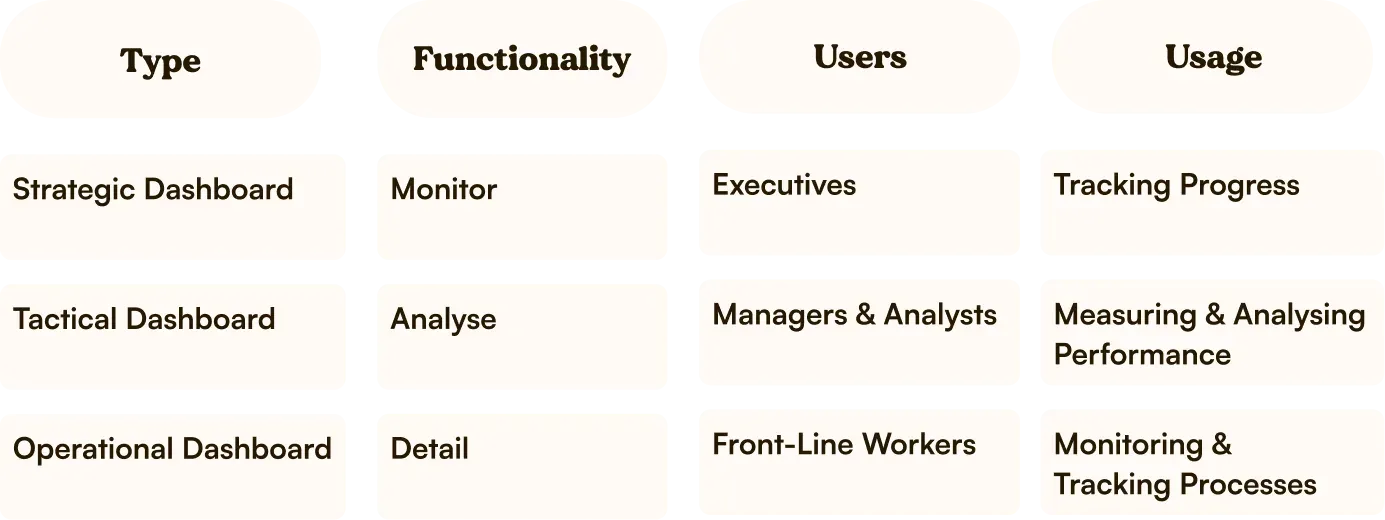
Desk research filled the rest. A paper by Artem Kruglov, Giancarlo Succi and Idel Ishbaev on metrics representation and dashboards gave me the taxonomy: targeting executives at the top level meant Culture+ Counter had to be a strategic dashboard, and that cascaded into every chart decision after it.
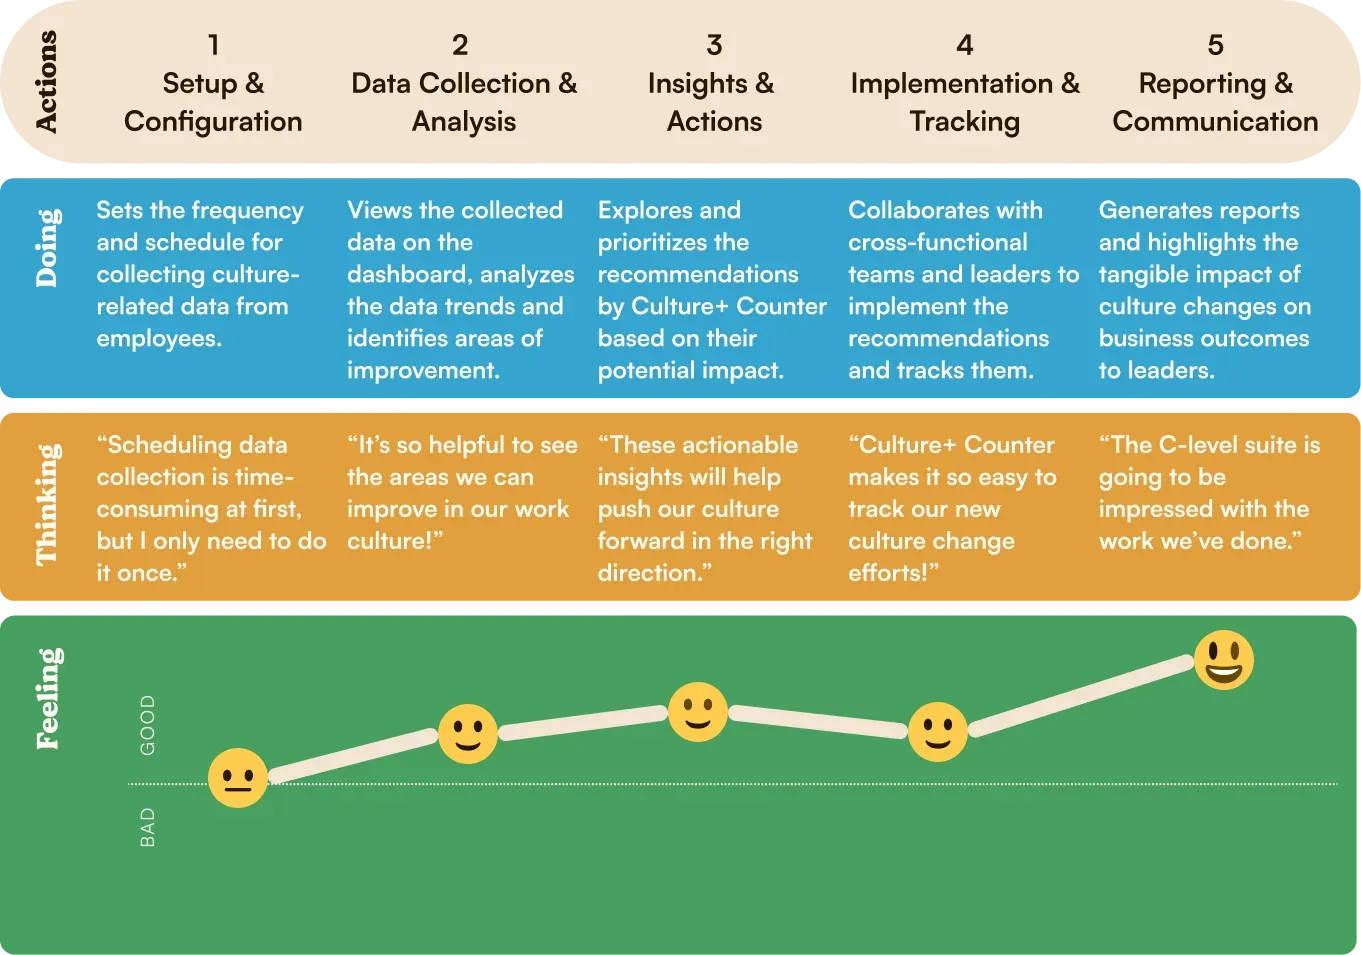
Three insights defined the product. First-time data collection would be slow, but only once. Analysis would surface uncomfortable things about a culture, so it had to arrive framed as constructive insight. And because the ideal user sat in HR, exporting reports mattered: their impact came from handing results to C-level executives.
Building it
NPS became the primary metric: efficient, widely accepted, and badly underused for work culture, since companies mostly pointed it at customers. Employee retention rate, project completion rates and leadership effectiveness assessments came in as secondary. We collected NPS through surveys visible to HR but not to the respondent’s manager, which is what bought us honest answers, used in tandem with 1-1s and performance reviews.
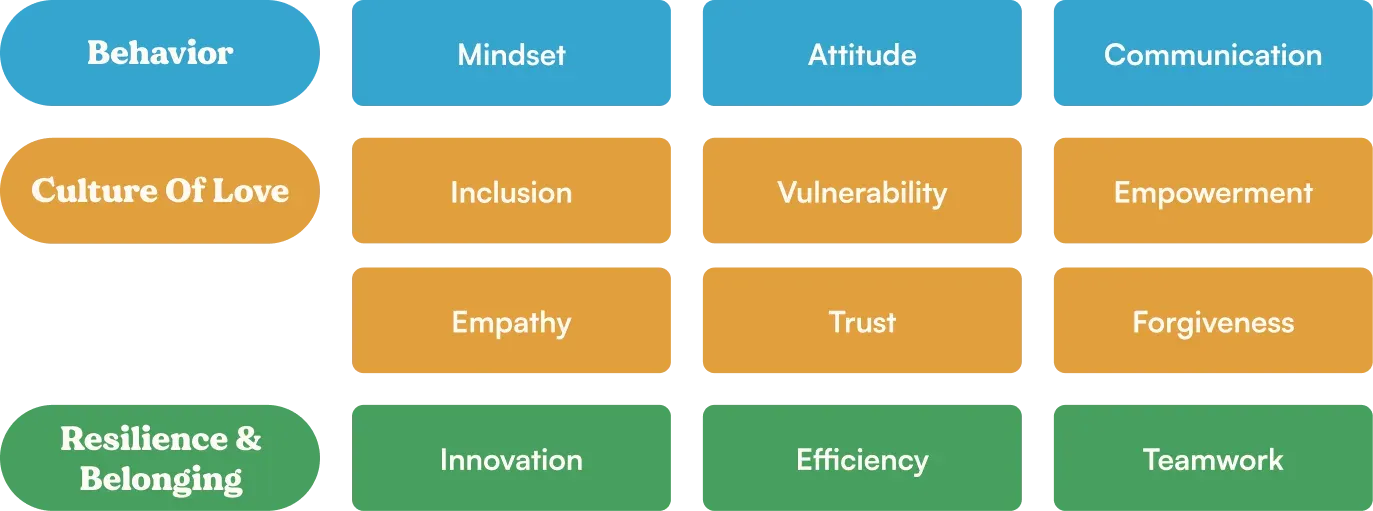
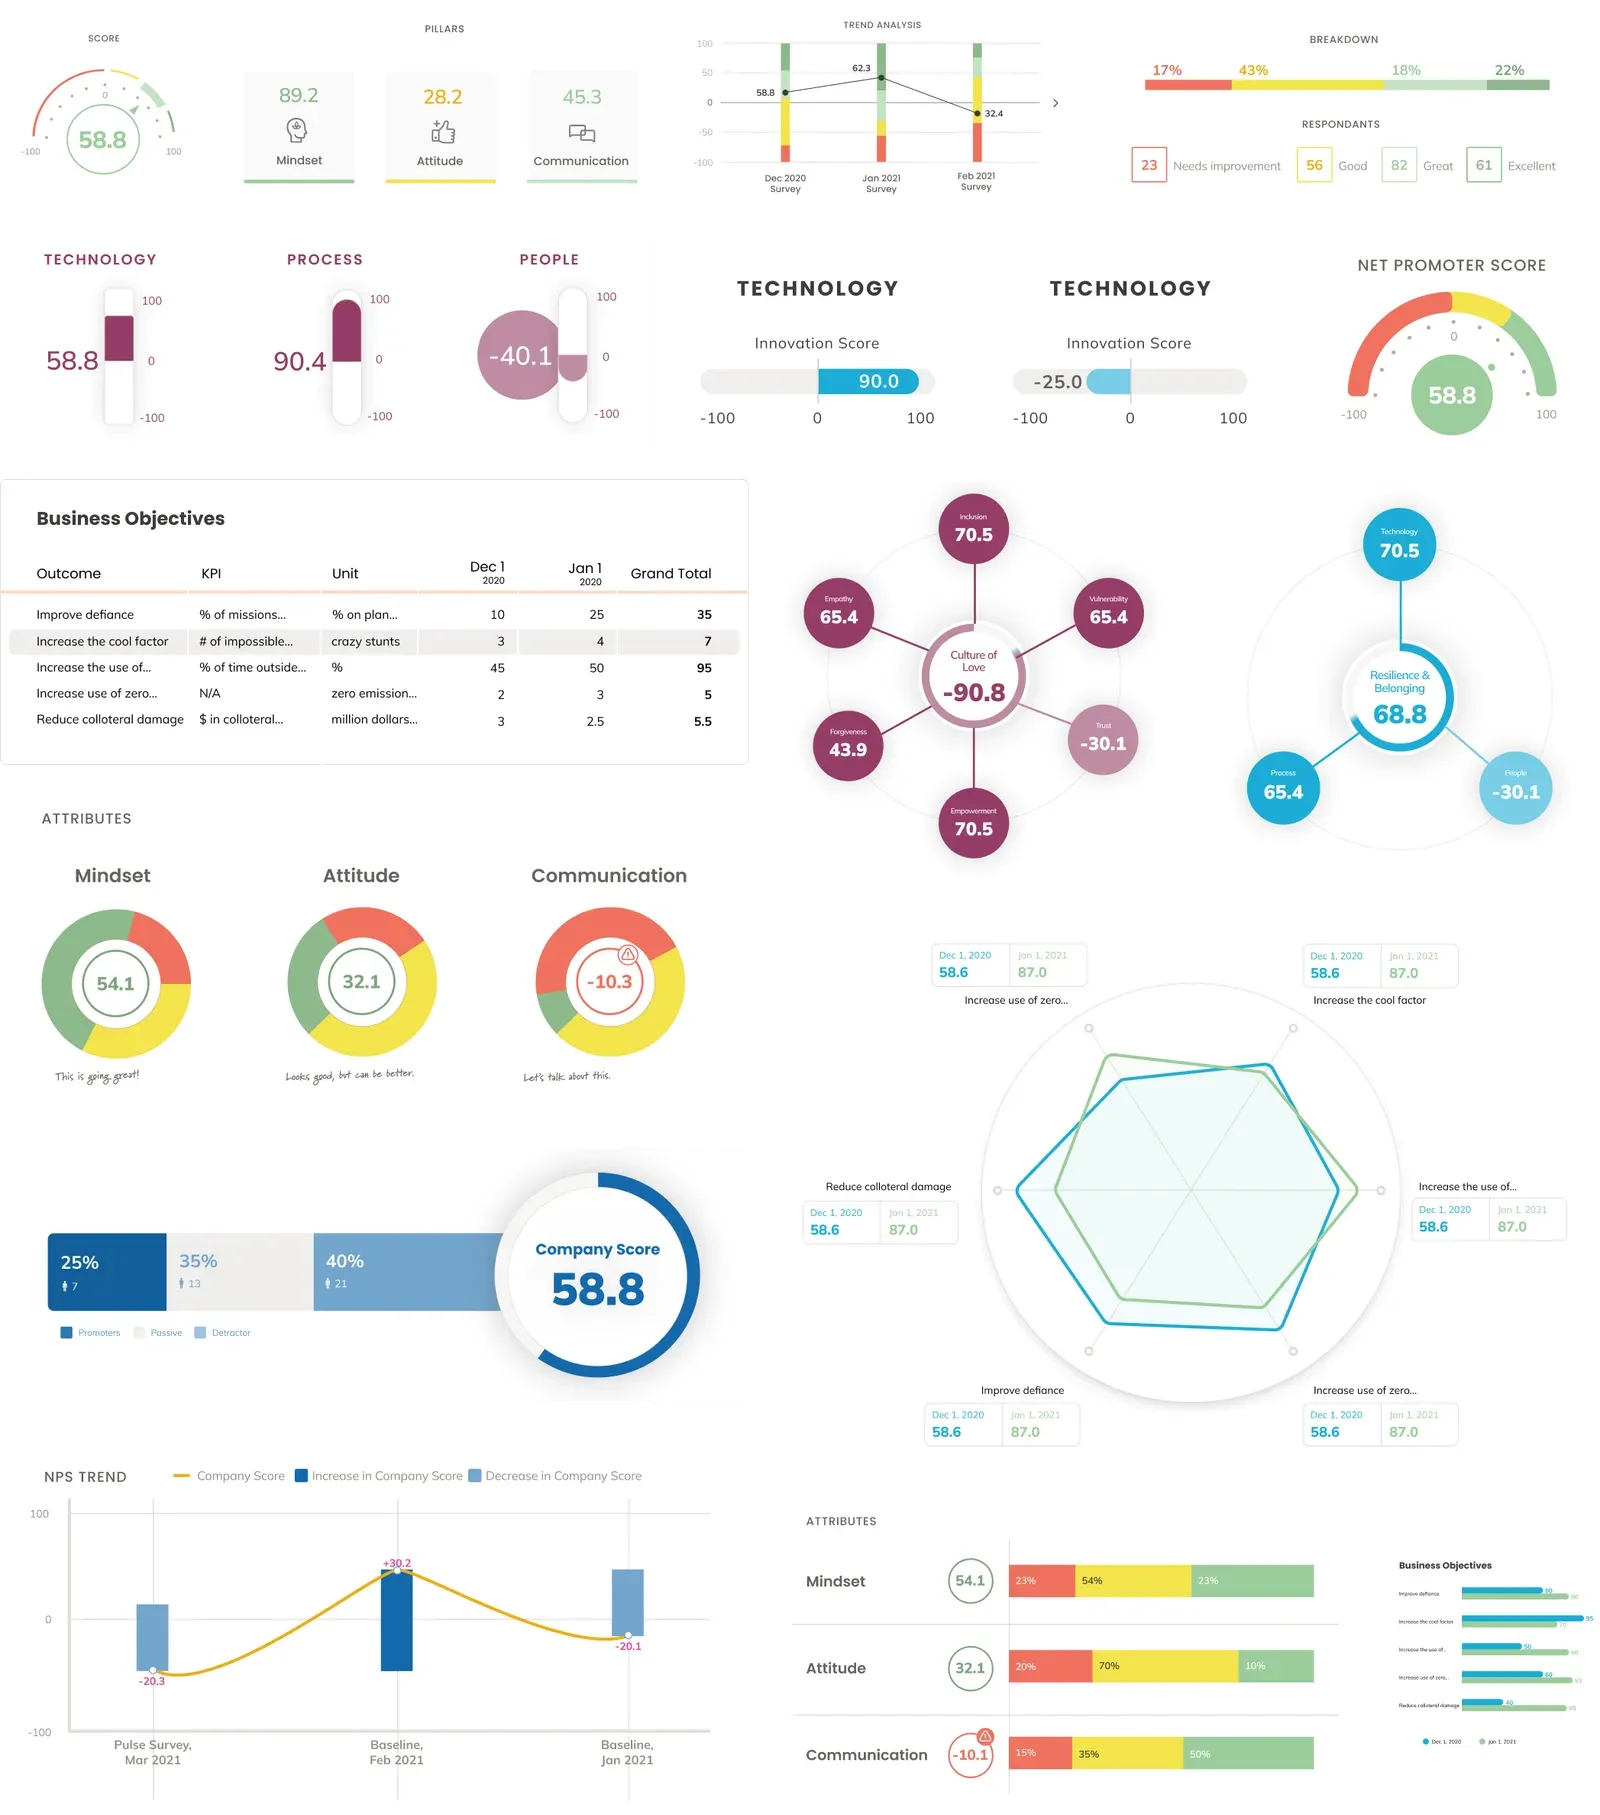
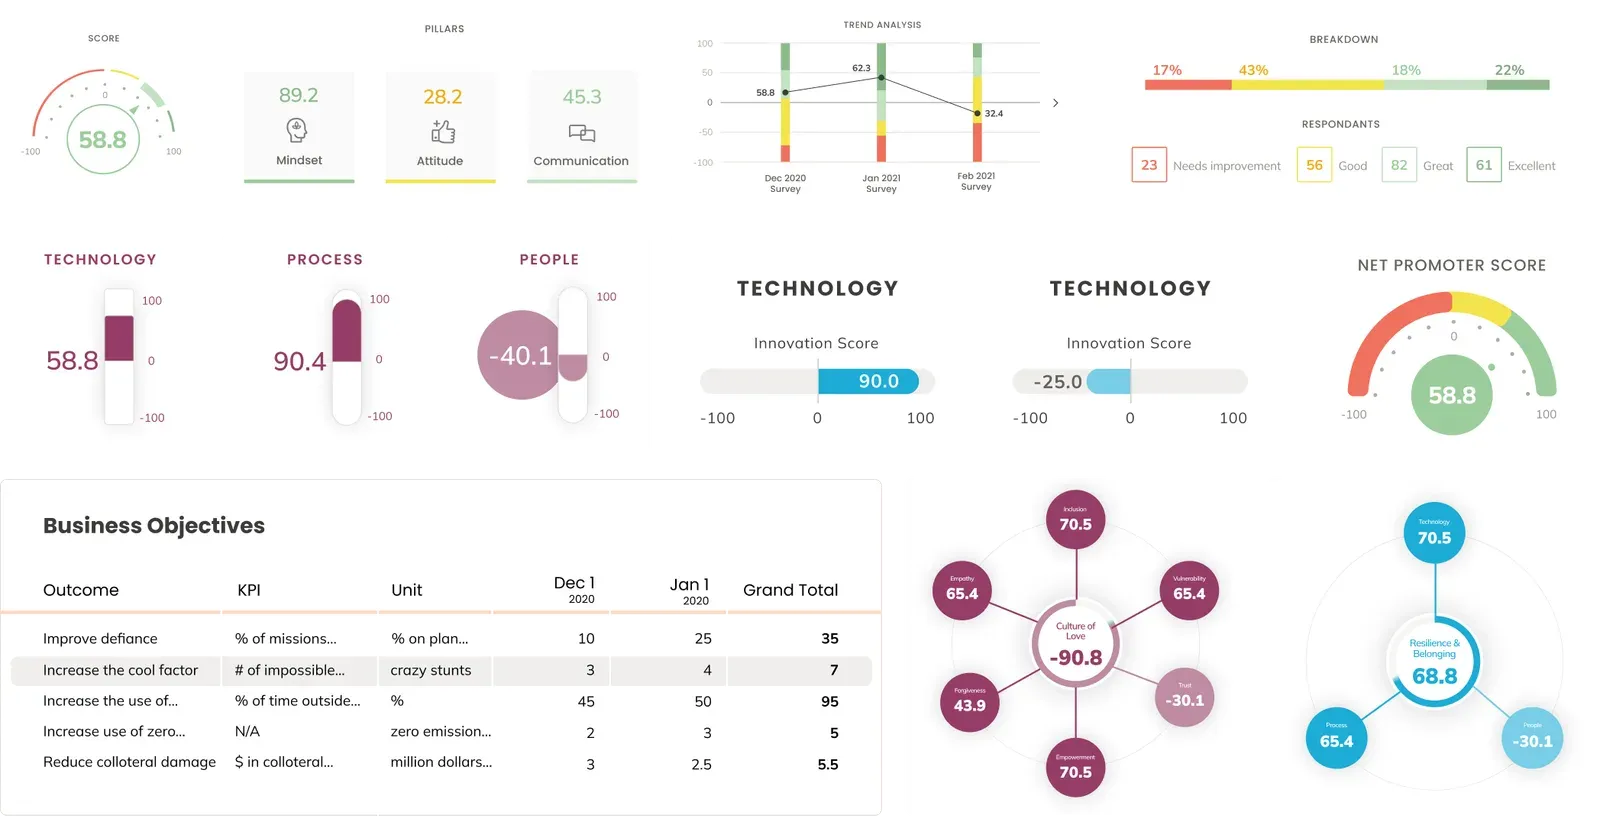
Two directions came out of the first round. The safe one led with business objectives as a horizontal bar chart, since those objectives are nominal variables, with the company score as a radar and insights beside it. The fancy one used a hexagonal chart so month-on-month patterns read at a glance, then chained circular diagrams into a causal story: Behavior influenced Culture of Love, which influenced Resilience and Belonging, which moved the company score.
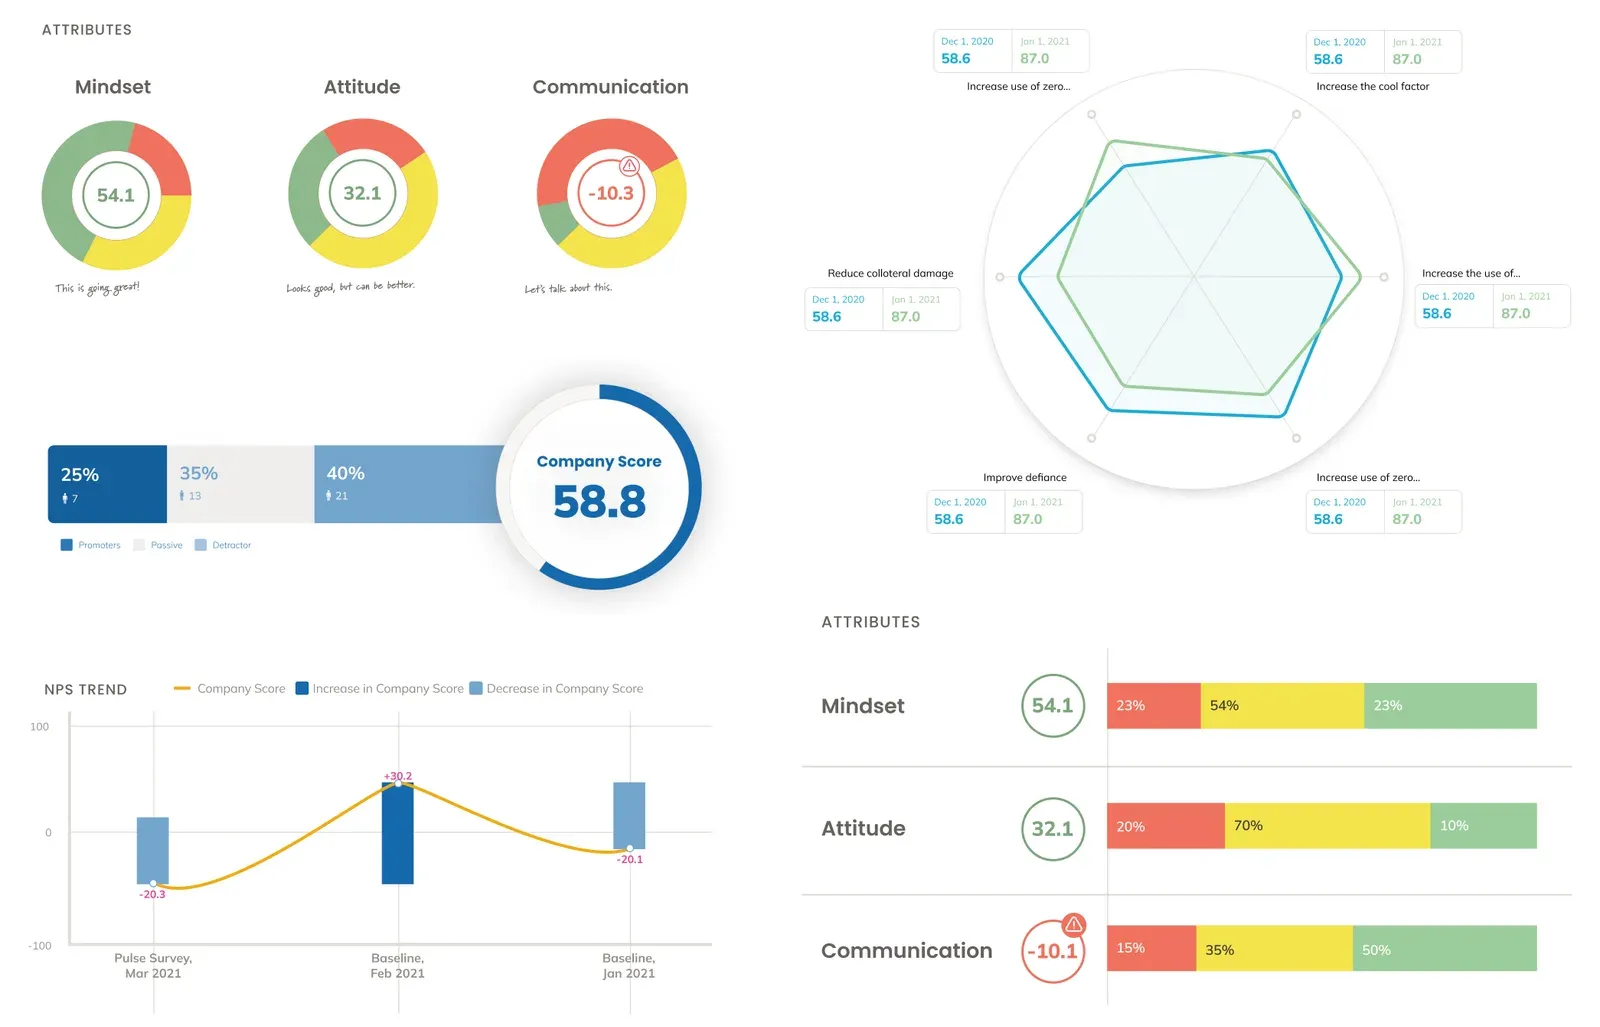
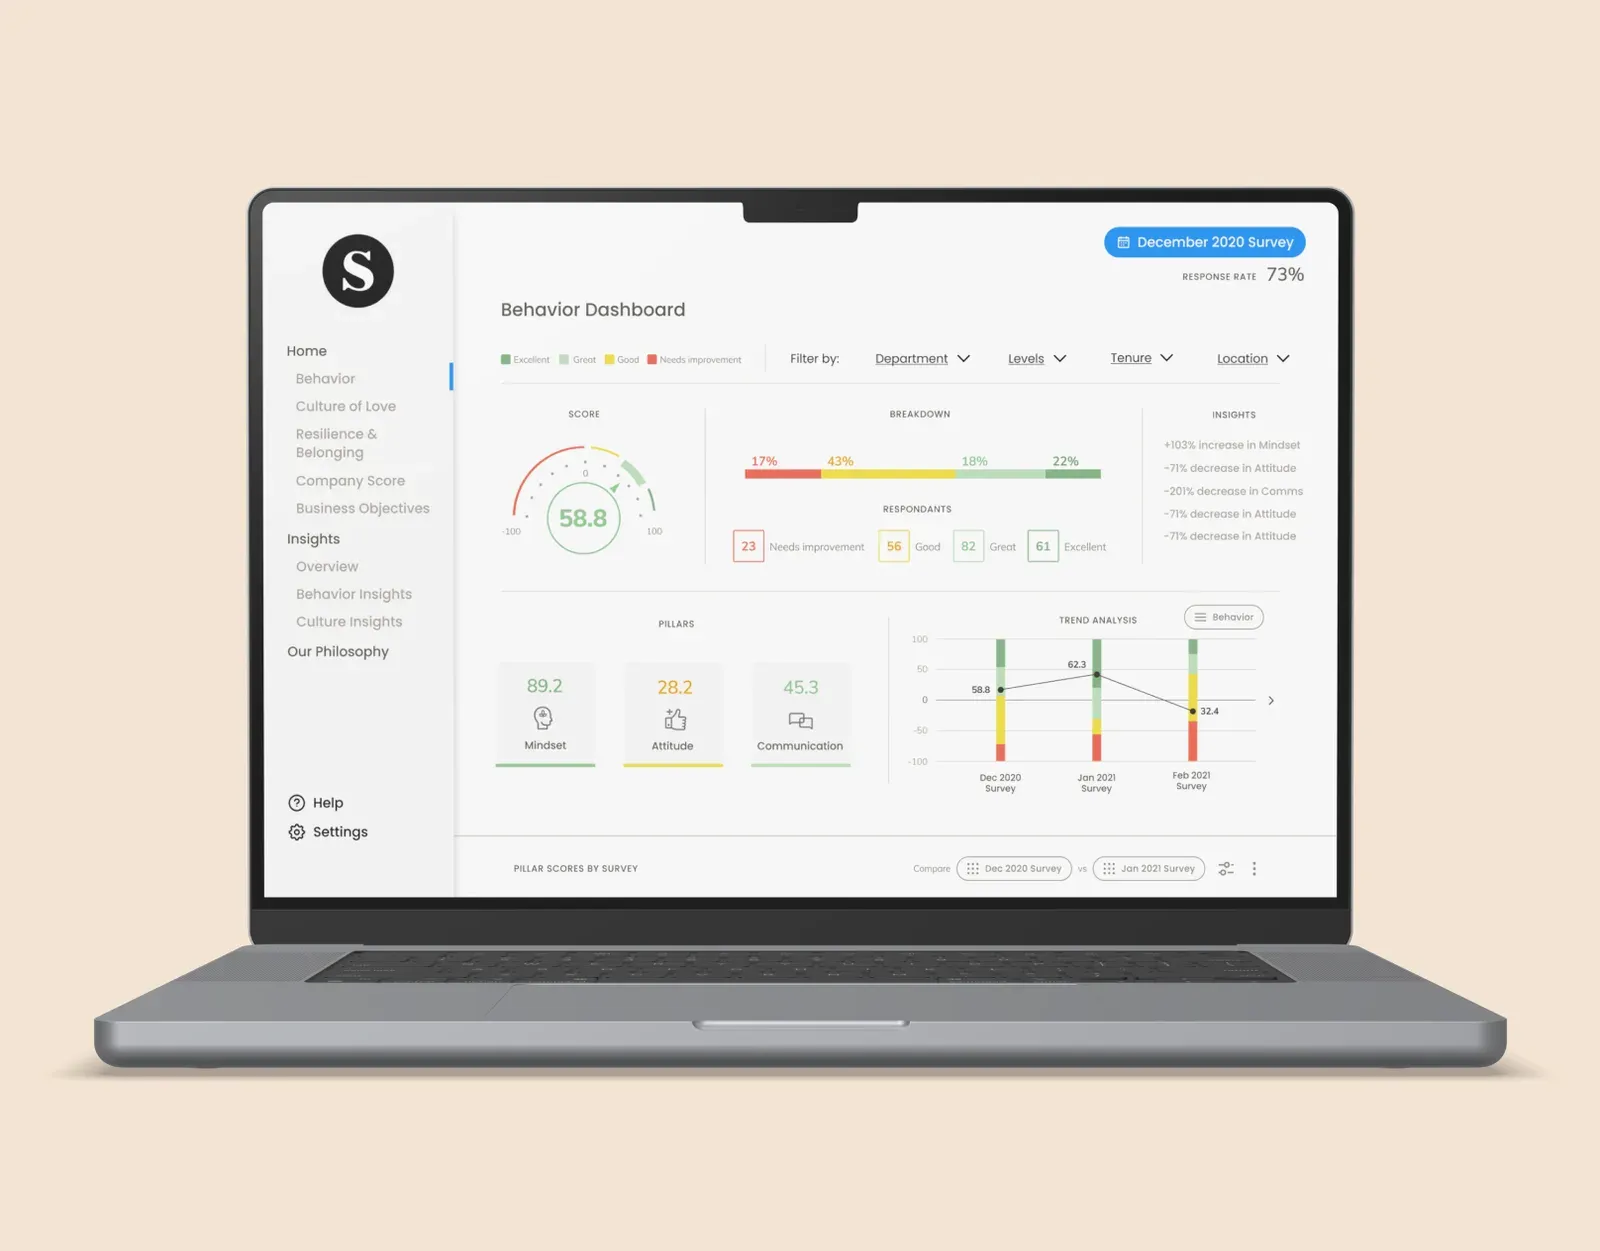
Round two added current-versus-baseline scores, alert states for scores low enough to need attention, speedometer charts because target users associated them closely with NPS, and horizontal stacked bars showing Promoters, Passives and Detractors.
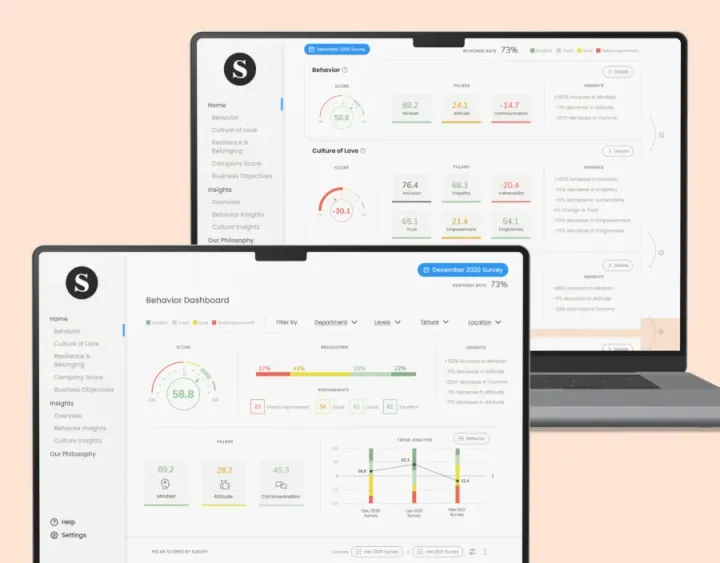
Leadership pushed the two together: less scrolling, quieter colour, insights next to the company score. The final design uses colour only to signal whether an aspect is Excellent, Great, Good or Needs Improvement, and states every business objective with its KPI, unit, month-on-month comparison and percentage change.
Outcome
We built the initial prototype with the engineering team, and sales presented it alongside the rest of the product suite. Softway won an enterprise roster off the back of it that included Google, Nuro, Genesys Works and Groupon.
It also answered the pain point it was built for: leaders could see aspects of culture measured, see how each affected the others, compare against a standard they recognised in NPS, act on insights pointing at specific parts of the org, and see business impact in the same view.
What I’d do differently
Every interview was internal. That was a real constraint in 2020, but it means the persona was built on Softway’s own leaders, who already believed the thesis. I’d have fought harder for two or three external HR executives before locking the metric model.
Export was the single most-requested capability from the HR persona, and it slipped to Phase 2. I’d cut a dashboard section from the first build to get a shareable report into it, because that’s the moment the tool travels to the C-suite on its own.
And I ran two full-fidelity directions through two rounds each before narrowing. After Phase 1 we learned to work in a more agile way, with fewer iterations. I’d start there rather than arrive there.